An explanation and an example measurement of the P300.
Electroencephalography (EEG) allows you to measure brain activity non-invasively. Many different methods have been designed to obtain information about different processes in the brain. Event-related potentials (ERPs) are characteristic brain waves that are present after an individual is exposed to a series of stimuli or events.1,2 The P300 is a specific type of ERP that is linked to neural processes like attention allocation, working memory, and decision-making.4
This blog describes what the P300 is and how you can detect it. Moreover, it includes a practical example of how a P300 response was measured using TMSi's SAGA, including the experimental protocol, a sample dataset, and all acquisition and processing codes. At the end of this blog, you will be able to download this sample data set and run through the scripts to view the P300 yourself.
What is the P300?
The P300 is a specific ERP that emerges approximately 300 ms after the presentation of a stimulus.3 As stated previously, it is linked to neural processes like attention allocation, working memory, and decision-making.4 The P300 is mostly evoked in the parietal, frontal, and central lobes along the midline.
The P300 is typically evoked through an auditory or visual oddball paradigm, where target stimuli are randomly interspersed among more frequent non-target stimuli.5 For example, an image of a cat (non-target stimulus) is frequently shown to the participant. Less frequently, the cat image is interrupted by an image of a tree (target stimulus). When the participant is actively engaged in detecting the less frequent target stimulus (the tree), their brain’s response to this target stimulus, compared to the non-target stimulus, has measurable differences that can be assessed.
How is the P300 assessed?
The P300 is mostly assessed on amplitude, latency, and mean voltage.4 The amplitude of the P300 is defined as the difference between the mean pre-stimulus baseline voltage and the largest positive peak within a specific time window. The latency of the P300 is measured in milliseconds (ms) and signifies the time interval between stimulus presentation and the largest positive peak within the specific time window. The mean voltage is determined in the same time window. The time window in the literature ranges from 200 ms to 600 ms after the stimulus.4,6-8
What can affect the P300's characteristics?
Several factors can influence the P300’s characteristics. Influencing factors are stress, anxiety, and attentional level.4,9,10 Moreover, external factors such as body temperature, sleep quality, exercise levels, dietary intake, coffee, and drug use, can influence the P300.5,11
Furthermore, the amplitude of P300 can be affected by the specific properties of the oddball paradigm.5 If the stimulus has been presented more often, participants can become more familiar with it, leading to a lower amplitude. Similarly, if an auditory stimulus is presented louder, it may be easier to distinguish the target from the background stimulus resulting in a lower amplitude, as there is less cognitive effort necessary.
How is a P300 response measured?
In the next sections, we will go over an example of a P300 measurement from the experiment to the analysis steps and the results. This same data set (with Python scripts) is shared if you would like to view and analyze the data yourself.
The experimental protocol
To obtain the P300 in the example data set, a double-active auditory oddball paradigm was used. In this protocol, target and non-target auditory stimuli are presented to the participant as sounds with different tones. The participant was instructed to lift the left index finger when hearing the non-target stimulus and the right index finger when hearing the target stimulus, making the paradigm double-active. A picture of a black cross was presented on a screen as a helpful tool for the participant to focus and not blink too often.
The measurement consisted of the presentation of a total of 60 stimuli with the probability of the target stimulus approaching 20%. Further details of the paradigm settings are shown in Table 1.
This sample data measured the complete 10/20 system including the M1 and M2 as reference electrodes.
Table 1: The stimuli and paradigm settings of the P300 measurement protocol.
| Stimuli Settings | Paradigm Settings | ||
| Tone non-target/target | 1000/2000 Hz | Attentional reminder | Black cross on screen |
| Sound volume | 60 dB | Active paradigm non-target/target | Tapping left/right |
| Duration | 200 ms | Reference electrodes | Both mastoids |
| Total number of stimuli | 60 | Max impedance | 30 kΩ |
| Probability of target | 0.2 | EEG Epochs | -200 ms to 800 ms |
| Interstimulus interval | 1500 ms | ||
Analysis of the P300 response
After the experiment, the pre-processing consisted of band-pass filtering with cut-off values of 0.5 and 35 Hz to filter out the drift and frequency above the brain activity frequencies. Moreover, the EEG data was re-referenced to the mastoids offline. Finally, ocular artifacts were removed using independent component analysis (ICA).
The P300 analysis focused on the electrodes P3, Pz, P4, C3, Cz, C4, F3, Fz, and F4. The pre-processed EEG data were segmented into epochs, with a time window ranging from -200 ms to 800 ms, where 0 ms corresponded to the stimulus onset. For each channel of interest, the average ERP was calculated separately for target and non-target stimuli. To perform baseline correction, for every channel the mean voltage during the 200 ms period preceding the stimulus onset was determined and subtracted from the signal.
The P300 assessment was performed in the time range of 250 to 500 ms.
Results of the P300 experiment
In Figure 1, the resulting average P300 as a response to target stimuli is shown. The y-axis shows the amplitude in microvolts and the x-axis shows the time in seconds, where 0 ms corresponds to the stimulus onset. The number in the upper right shows the number of presented stimuli, e.g. 17 target stimuli were presented. The colors of the P300 lines correspond to the different electrodes analyzed, further indicated by the topological map in the upper left.
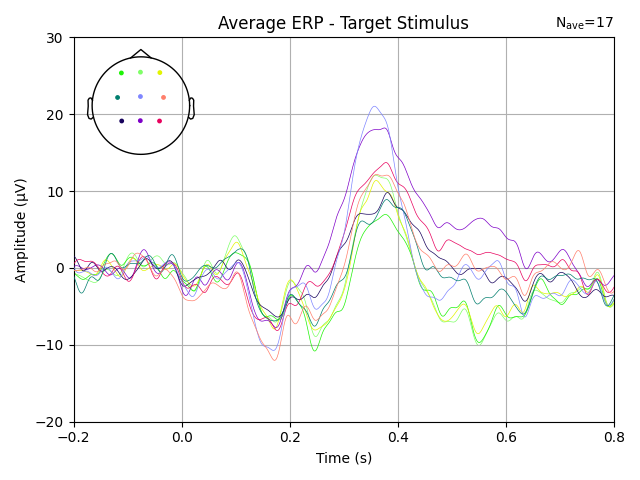 Figure 1: The average P300 as evoked from the sample data.
It can be seen that the peak is present in the time range of interest (250 to 500 ms), thus this is the P300. Moreover, there is a clear distinction between the amplitude and mean voltage of the baseline period and the P300 peak.
In Figure 2, a comparison of the target and non-target response of the Cz electrode is shown. This result displays clearly that the peak around 300 ms is only present in the response to the target.
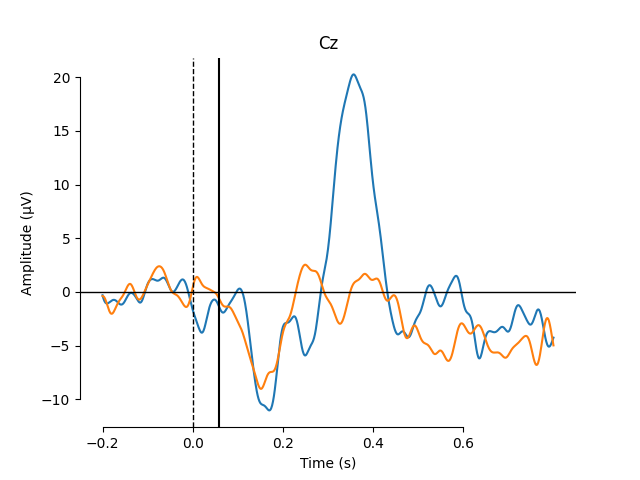 Figure 2: The average EEG response to the target (blue) and non-target (orange) of the Cz electrode.
Both figures show that the experimental protocol, based on the odd-ball paradigm, evoked a P300 wave in this participant.
Conclusion
This blog explained what the P300 is and shared an example measurement protocol of the P300. Moreover, it described the analysis steps needed to go from the raw EEG data to the P300 wave.
The data was measured using TMSi's APEX. TMSi specializes in making high-quality electrophysiological measuring solutions. TMSi also offers a software example that performs the analysis steps described in this blog. In this knowledge base article, the example data set is shared alongside the python code for the analysis of the P300. The knowledge base describes the analysis steps in more detail and explains how you can run the analysis yourself.
Are you interested in performing ERP research? Contact info@tmsi.com or check out our website to learn more about how we can help you.
References
- Steven J An Introduction to the Event-Related Potential Technique. 2nd ed. Vol. 1. Cambridge: The MIT Press, 2014, pp. 1–575.
- Steven J. Luck et al. “Standardized measurement error: A universal metric of data quality for averaged event-related potentials”. In: Psychophysiology 6 (June 2021), e13793. doi: 10.1111/psyp.13793.
- Masataka Wada et al. “The P300 event-related potential in bipolar disorder: A systematic review and meta-analysis”. In: Journal of Affective Disorders 256 (Sept. 2019), 234–249. doi: 10.1016/j. jad.2019.06.010.
- John Polic Updating P300: An integrative theory of P3a and P3b. Oct. 2007. doi: 10.1016/j. clinph.2007.04.019.
- Rikvan Dinteren et al. “P300 development across the lifespan: A systematic review and meta-analysis”. In: PLoS ONE 2 (Feb. 2014), e87347. doi: 10.1371/journal.pone.0087347.
- Zenker and J. J. Barajas. “Auditory P300 development from an active, passive and single-tone paradigms”. In: International Journal of Psychophysiology 33.2 (Aug. 1999), pp. 99–111. doi: 10. 1016/S0167-8760(99)00033-1.