Insights into the different research possibilities of HD-EMG
Which additional insights can you gain from measuring muscle activity with High-Density (Surface) EMG over bipolar EMG?
Bipolar EMG provides a general, global measure of muscle activity using two electrodes. HD-EMG measures the regional muscle activation at the skin’s surface using at least four closely spaced electrodes. Therefore, HD-EMG can capture regional differences in muscle activation.1 Furthermore, HD-EMG's utilization of multiple channels enables diverse detection points of motor units. This allows for the recognition of single motor unit activity. HD-EMG thus provides more insights into muscle activation compared to bipolar EMG.
HD-EMG measurements also provide information about muscle fiber activity. The firing of a motor neuron leads to the generation of action potentials in the innervated muscle fibers. From the innervation point, the action potentials travel in both directions along the muscle fiber toward the tendons on either side of the muscle. Traditionally, assessment of this muscle fiber activity required invasive intramuscular EMG, which was limited to specific professions.2 In contrast, HD-EMG is a non-invasive technique using grids at the skin’s surface. Therefore, HD-EMG offers a more easily accessible measurement method.
In this blog, HD-EMG measurements will be classified into measurement domains based on the extracted information from the HD-EMG signals. The three primary measurement domains for HD-EMG are regional activation, muscle fiber properties, and single motor unit activity.3 Possible applications of HD-EMG in these three domains will be explored.
What are the three main measurement domains of HD-EMG?
Regional activation
Regional activation refers to the detection of the electric potentials within a muscle or in different muscles. As explained in the introduction, electric potentials result from the firing of motor units, which innervate different muscle fibers within a muscle. Regional activation includes the estimation of the location, size, and magnitude of the active regions of superficial muscles.3
The regional activation can be evaluated using an activation map. The activation map shows the intensity of the EMG signal, which is the normalized EMG amplitude distribution. This is determined by its root mean square value (RMS-value).3,4 In Figure 1, an example of the activation map of a grid positioned over the trapezius muscle is included. The colors reflect the level of activation.4 As shown in the figure, the muscle activation differs depending on the specific region of the muscle. This video shows a sample recording including an activation heatmap, measured with TMSi’s Textile HD-EMG grid.
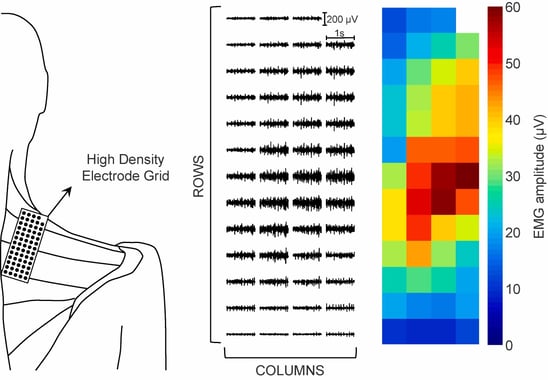 Figure 1: Placement of the grid over the muscle of interest (trapezius), with the measured HD-EMG signals (middle) and the amplitude represented by the RMS value (right).4
Changes in the regional activity of a muscle can be observed with an HD-EMG grid placed over that muscle. The changes are represented by variations in the intensity of the EMG signal over time. Regional activation can be changed to redistribute load, minimize muscle fatigue, and enhance endurance. This changing activation relieves muscle fibers which are active from the beginning of the task.4
How is regional activation used in research?
An example of how regional activation can be used is for the investigation of acute intermittent hypoxia (AIH). Acute intermittent hypoxia therapy involves recurrent, brief periods of breathing low-oxygen gas. AIH may alter muscle activation by enhanced activation or excitability of the motor neurons. This alteration can be evaluated by measuring regional activation using HD-EMG before and after AIH. In a study, the effect of AIH as a neuromodulation technique in patients with incomplete spinal cord injury is investigated. In Figure 2, the muscle activation map of the biceps is included before (C) and 60 minutes after (D) the AIH. From the activation maps, it can be concluded that muscle activity is increased after AIH. AIH therapy thus improves the level of voluntary neural activation of the biceps.5
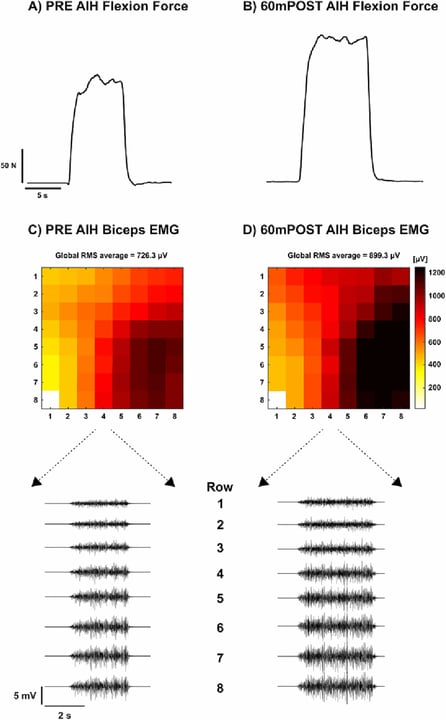 Figure 2: Flexion force of the upper arm A) before and B) after AIH. The corresponding HD-EMG signal of the biceps C) before and D) after AIH, with the corresponding row EMG signals (below).5
Estimation of muscle fiber properties
During muscle activation, the firing of a motor neuron causes a depolarization at the neuromuscular junction. The resulting action potential propagates along the muscle fibers in both directions. Details about this action potential propagation can be described with muscle fiber properties. These can be measured non-invasively with HD-EMG, if the electrodes are placed parallel to the muscle fibers. Muscle fiber properties are unrelated to neuromuscular activation patterns, as they are dependent on the anatomy and the membrane properties of a muscle.3 Membrane properties may change because of changing ionic concentrations.
Muscle fiber properties include (3):
- conduction velocity
- location of the innervation zone
- location of the muscle-tendon regions
- fiber orientations
- muscle fiber length
- location of the muscle fibers a single motor neuron innervates (motor unit)
How can conduction velocity be estimated, and what are its practical applications?
The conduction velocity is the velocity at which a motor unit action potential (MUAP) propagates along a muscle fiber during contractions. The MUAP reaches the electrodes, placed at a fixed distance from each other, with a certain time delay. From this time delay and the fixed inter-electrode distance, the conduction velocity can be estimated.6 In Figure 3, P1, P2, P3, P4, and P5 are different electrodes at the skin’s surface. In the top right, the MUAPs measured at the different electrodes (P1, P2, P3) with a time delay are included. As the distance between the electrodes P1, P2, and P3 is known, the conduction velocity can be calculated.6
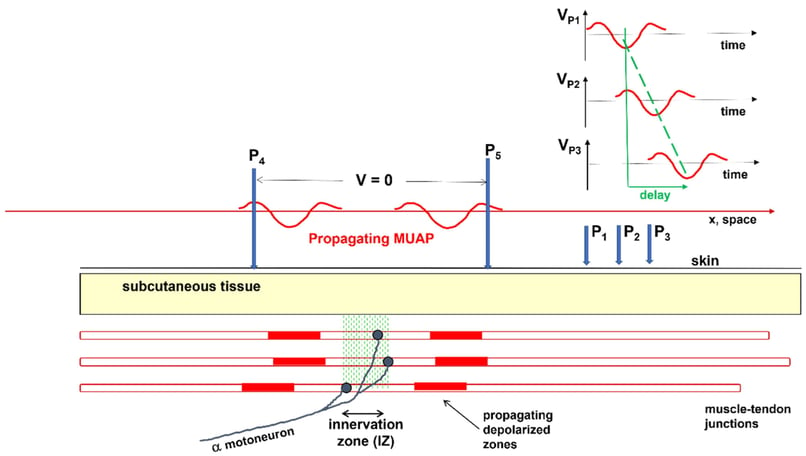 Figure 3: Estimation of conduction velocity of the MUAP, from the known distance between P1 and P3 and the measured time-delay.6
With increasing muscle fatigue, the conduction velocity decreases because of changing ionic concentrations. In the research of Brouwer et al., the conduction velocity of the lower back muscles is calculated with HD-EMG in fatiguing conditions. Two different methods to calculate the conduction velocity are compared to assess the reliability. A reliable estimate of the conduction velocity of the lower back muscle could serve as a measure of muscle fatigue.7
How is the innervation zone localized, and when is it useful to know its location?
Another muscle fiber property is the location of the innervation zone. The action potential travels from the innervation zone to both ends of the muscle fibers. In HD-EMG signals, the polarity of the signals at both ends of the muscle fibers is reversed. This enables the estimation of the innervation zone. The innervation zone is the point where the polarity of the HD-EMG signals inverses.3,6 This is illustrated in Figure 4, the polarity changes sign between rows 9 and 10 as is shown in the second-last and the last column.8
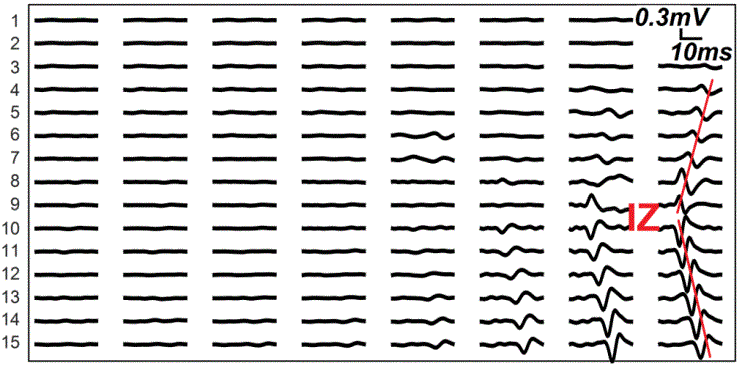 Figure 4: Localization of the innervation zone (IZ) using the amplitude and the polarity of the HD-EMG signals.8
Localization of the innervation zone of a muscle is valuable for botulinum neurotoxin injections. Botulinum neurotoxin injection prevents stiffened muscles from contracting. Therefore, it can treat focal spasticity. Given that the effectivity of the botulinum neurotoxin injection reduces with increasing distance from the innervation zone, precisely localizing the innervation zone is important for effective treatment. Therefore, in the research of Liu et al., the location of the innervation zone was identified using HD-EMG, to guide botulinum neurotoxin injection.9
Single Motor Unit Activity
The last main measurement domain of HD-EMG focuses on the study of single motor unit activity. This involves the identification of the firing pattern of several motor units located close to the skin surface.3 Motor neuron discharges result in MUAPs in the muscle fibers. The summation of these MUAPs is the HD-EMG signals. The firing pattern of motor units and their corresponding MUAPs can be extracted from the HD-EMG signal using decomposition, a processing method. The decomposition of the HD-EMG signal to single motor unit activity provides an estimate of the neural drive to the muscle.10, such as motor unit firing rate and recruitment threshold. The relation between motor unit discharge and the EMG signal is illustrated in Figure 5.
.jpg?width=621&height=256&name=High-Density%20EMG%20Motor%20Unit%20Action%20Potentials%20(MUAPs).jpg) Figure 5 : The motor neurons discharge (left), resulting in MUAPS (right). The EMG is the summation of these MUAPs. Using decomposition algorithms, both the MUAPs and discharge times can be extracted from the HD-EMG signals (yellow arrows).10
Figure 5 : The motor neurons discharge (left), resulting in MUAPS (right). The EMG is the summation of these MUAPs. Using decomposition algorithms, both the MUAPs and discharge times can be extracted from the HD-EMG signals (yellow arrows).10
Learn more about Motor Unit Decomposition in this webinar:
What research utilizes single-motor unit activity?
Research utilizes single motor unit activity to achieve a deeper understanding of the neuromuscular system, by extraction of the discharge characteristics of the single motor units.2 These characteristics give insights into motor control strategies, morphological and functional properties of motor units, and their adaptation to certain conditions. Such insights are valuable for the investigation of the effect of neuromuscular pathologies, fatigue, and exercise interventions.1,3
Single motor unit activity is for example investigated in a study on the activity of motor neurons in ALS. In ALS, the degradation of lower motor neurons results in compensatory changes in motor unit characteristics. This occurs as the remaining motor units reinnervate the muscle fibers. The slow-type muscle fibers are most resistant to the disease, whereas the fast, fatigable motor units are most susceptible to the disease. Therefore, the fatigable motor units degrade earlier in the disease. This degradation is compensated for by innervation of slow-type motor units.11
It is suggested that the slow-type muscle fibers, after compensatory reinnervation, might alter their phenotype to the fast fatigable motor units. As a result, they become more susceptible to the disease. In the study, the motor unit size and their firing behavior are analyzed across various stages of the disease to analyze the compensatory innervation in ALS disease progression.11
Conclusion
In contrast to bipolar EMG, HD-EMG simultaneously records muscle activity with more closely spaced electrodes. HD-EMG’s non-invasive nature, combined with its capability to capture regional muscle activation, assessment of muscle fiber properties, and the investigation of single motor unit activity, makes it a powerful tool for the investigation of movement, muscle function and nervous system control strategies.6
TMSI’s Flexible Textile HD-EMG grids facilitate applications across the three domains. The activation pattern of muscles of all shapes and sizes can be captured with a clean and low-noise HD-EMG signal. More about the HD-EMG grids can be found here.
References
- Merletti, R., & Farina, D. (2016). Surface Electromyography: Physiology, Engineering and Applications. In Surface Electromyography: Physiology, Engineering and Applications. Wiley-IEEE Press. https://doi.org/10.1002/9781119082934
- Besomi, M., Hodges, P. W., van Dieën, J., Carson, R. G., Clancy, E. A., Disselhorst-Klug, C., Holobar, A., Hug, F., Kiernan, M. C., Lowery, M., McGill, K., Merletti, R., Perreault, E., Søgaard, K., Tucker, K., Besier, T., Enoka, R., Falla, D., Farina, D., … Wrigley, T. (2019). Consensus for experimental design in electromyography (CEDE) project: Electrode selection matrix. Journal of Electromyography and Kinesiology, 48, 128–144. https://doi.org/10.1016/j.jelekin.2019.07.008
- Gallina, A., Disselhorst-Klug, C., Farina, D., Merletti, R., Besomi, M., Holobar, A., Enoka, R. M., Hug, F., Falla, D., Søgaard, K., McGill, K., Clancy, E. A., Carson, R. G., van Dieën, J. H., Gandevia, S., Lowery, M., Besier, T., Kiernan, M. C., Rothwell, J. C., … Hodges, P. W. (2022). Consensus for experimental design in electromyography (CEDE) project: High-density surface electromyography matrix. Journal of Electromyography and Kinesiology, 64, 102656. https://doi.org/10.1016/J.JELEKIN.2022.102656
- Falla, D., & Gallina, A. (2020). New insights into pain-related changes in muscle activation revealed by high-density surface electromyography. Journal of Electromyography and Kinesiology, 52, 102422. https://doi.org/10.1016/J.JELEKIN.2020.102422
- Afsharipour, B., Pearcey, G. E. P., Rymer, W. Z., & Sandhu, M. S. (2023). Acute intermittent hypoxia enhances strength, and modulates spatial distribution of muscle activation in persons with chronic incomplete spinal cord injury. Experimental Neurology, 367, 114452. https://doi.org/10.1016/J.EXPNEUROL.2023.114452
- Campanini, I., Merlo, A., Disselhorst-Klug, C., Mesin, L., Muceli, S., & Merletti, R. (2022). Fundamental Concepts of Bipolar and High-Density Surface EMG Understanding and Teaching for Clinical, Occupational, and Sport Applications: Origin, Detection, and Main Errors. Sensors, 22(11), 4150. https://doi.org/10.3390/S22114150/S1
- Brouwer, N. P., Tabasi, A., Kingma, I., Stegeman, D. F., van Dijk, W., Moya-Esteban, A., Sartori, M., & van Dieën, J. H. (2022). Low back muscle action potential conduction velocity estimated using high-density electromyography. Journal of Electromyography and Kinesiology, 66, 102679. https://doi.org/10.1016/J.JELEKIN.2022.102679
- Zhang, C., Dias, N., He, J., Zhou, P., Li, S., & Zhang, Y. (2020). Global Innervation Zone Identification with High-Density Surface Electromyography. IEEE Transactions on Bio-Medical Engineering, 67(3), 718. https://doi.org/10.1109/TBME.2019.2919906
- Liu, Y., Ning, Y., Li, S., Zhou, P., Rymer, W. Z., & Zhang, Y. (2015). Three-Dimensional Innervation Zone Imaging from Multi-Channel Surface EMG Recordings. Https://Doi.Org/10.1142/S0129065715500240, 25(6). https://doi.org/10.1142/S0129065715500240
- del Vecchio, A., Holobar, A., Falla, D., Felici, F., Enoka, R. M., & Farina, D. (2020). Tutorial: Analysis of motor unit discharge characteristics from high-density surface EMG signals. Journal of Electromyography and Kinesiology, 53, 102426. https://doi.org/10.1016/J.JELEKIN.2020.102426
- Weddell, T., Bashford, J., Wickham, A., Iniesta, R., Chen, M., Zhou, P., Drakakis, E., Boutelle, M., Mills, K., & Shaw, C. (2021). First-recruited motor units adopt a faster phenotype in amyotrophic lateral sclerosis. The Journal of Physiology, 599(17), 4117–4130. https://doi.org/10.1113/JP281310