The new Textile HD-EMG grids allow you to record high-quality HD-EMG signals, even in difficult locations. Here you can download example recordings, so you can investigate the data quality yourself. This blog will explain how we recorded this facial muscles dataset and how you can import the dataset and perform your analysis.
What was recorded?
The HD-EMG measurement has been done using the 8-8-L Textile Grid (8x8 topology, 8.75 mm IED) on facial muscles, see Figure 1. The 64-channel grid was placed on the left side of the participant's face. The grid can also be cut in half, in two 32-channel variants to cover both sides of the face if desired.
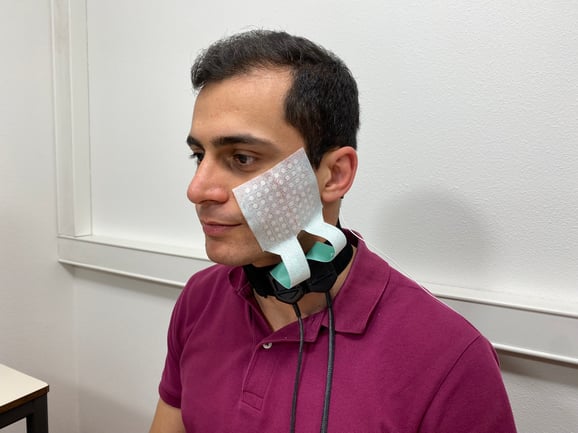
Figure 1: Textile grid placement on facial muscles.
The skin was shaved prior to the measurement and the skin surface (on the face and the mastoid) was prepared using an abrasive gel. The sample data recording contains raw HD-EMG signal, measured with the SAGA amplifier (set to common reference) and sampled at 2000 Hz (analogue bandwidth: DC – 700 Hz). The common reference electrode was placed on the left mastoid.
The recording file contains EMG data for four different facial expressions performed by the participant with 20 seconds of rest (neutral expression) between each. Each of the following four facial mimics was held for 10 seconds by the participant: (1) Closing eyes forcefully, (2) smiling with open mouth, (3) blowing out the cheeks, (4) snarling.
What does the data show?
Figure 2 contains heatmaps that visualize facial muscles' activation patterns. Root mean square (RMS) values of the EMG signal recorded during four different facial expressions are used to generate these heatmaps. The color bar on the right shows the amplitude range in µVolts.
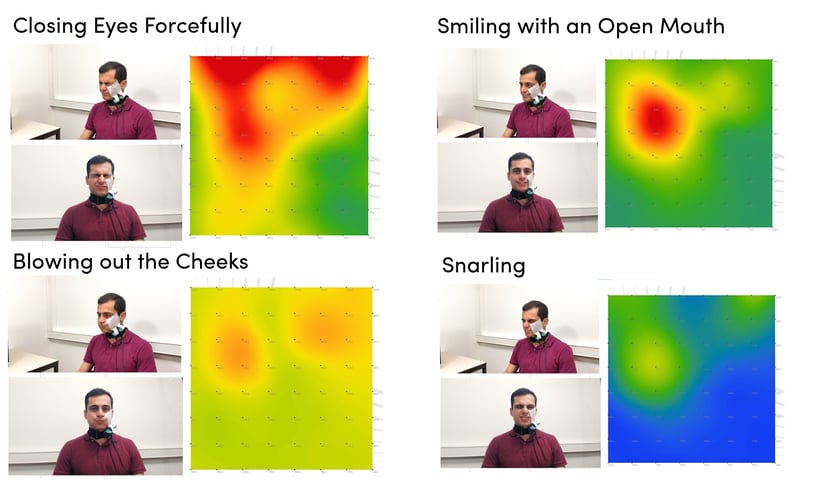 Figure 2: Heatmaps during four different facial expressions using RMS values of the EMG signal
Furthermore, raw HD-EMG data from a single row of electrodes is shown in Figure 3. This is a recording while the participant was smiling with an open mouth.
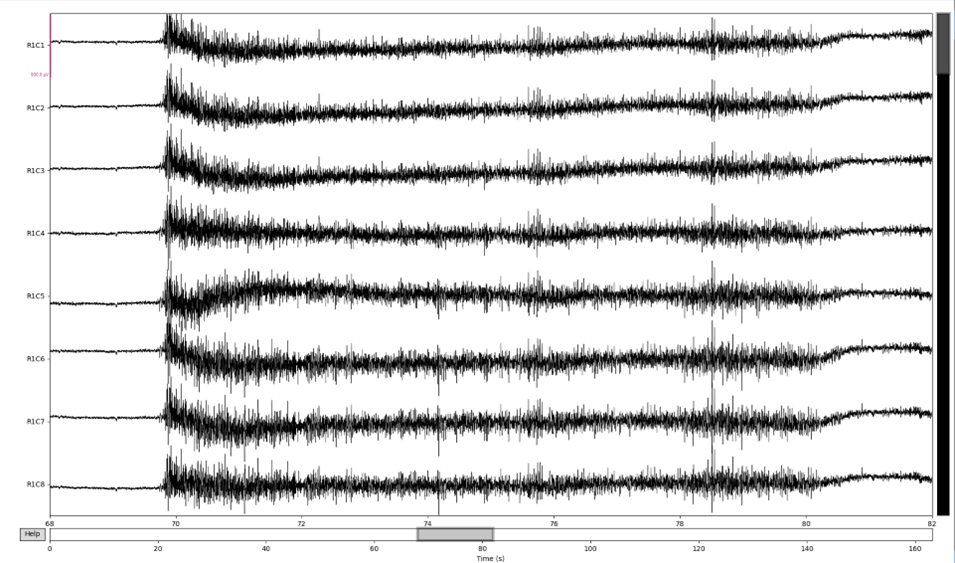
Figure 3: Single row of raw HD-EMG data while the participant smiled with an open mouth.

How can I view or analyze the data myself?
To view the data, you can import the recordings into our file viewer. To perform data analysis, you can use TMSi Python interface to import the recordings into Python. Please follow the installation instructions in the Documentation TMSi Python Interface. After installation, you can load the data into Python with the example script example_file_reader.py in the folder examples_reading_data of the TMSi Python Interface.
Would you like to know more?
Measuring HD-EMG on facial muscles can be quite a challenge, which is why we recommend using Textile HD-EMG Grids. These grids come with an adhesive for easier preparation and application. Also, the grids are made from a textile material that forms well to the skin, ensuring reliable adherence even during movement. This results in high-quality raw data allowing you to measure HD-EMG signals in difficult locations effortlessly.
The Textile HD-EMG grids come in 6 configurations, suited for measuring different muscles. Would you like to learn more about these Textile grids? Click here to book a free demo and ask your questions to our specialists. If you have any questions about this dataset, please email info@tmsi.com.