The new Textile HD-EMG grids allow you to record high-quality HD-EMG signals. Here you can download three example recordings, so you can investigate the data quality yourself. This blog will explain how we recorded this dataset and how you can import the dataset and perform your analysis.

What was recorded?
The HD-EMG measurement has been done using the 8-8-L Textile Grid (8x8 topology, 8.75 mm IED) on the gastrocnemius muscle, see figure 1. The 64-channel grid covers both the medial and lateral head to show the flexibility of the grid. The grid can also be cut in half, in two 32-channel variants to cover each head more precisely.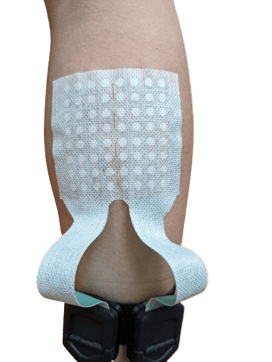
Figure 1: Textile grid placement on the gastrocnemius muscle.
The skin was shaved prior to the measurement and the skin surface was prepared using an abrasive gel. The three sample data recordings show the raw HD-EMG signal, measured with the SAGA amplifier (with average reference) and sampled at 2000 Hz (analogue bandwidth: DC – 700 Hz). The three files show the data for three different tasks performed by the participant:
- First, the participant sat on a chair in a relaxed position in a way that the gastrocnemius muscle is at rest (no voluntary contraction).
- Second, the participant performed a constant calf raise and kept it during the whole time of measurement.
- Third, the participant performed multiple squat jumps during the measurement.
What does the data show?
Below, two types of analysis of the data are shown. Figure 2 shows the average power frequency spectrum of the raw signal of all 64 channels for the three measurements. In the recordings where muscle activity was recorded (constant calf raise and squat jumps), no mains interference can be seen. For the "rest” condition, as there is no muscle activity present and therefore lower power in general, there are small peaks at 50 Hz.
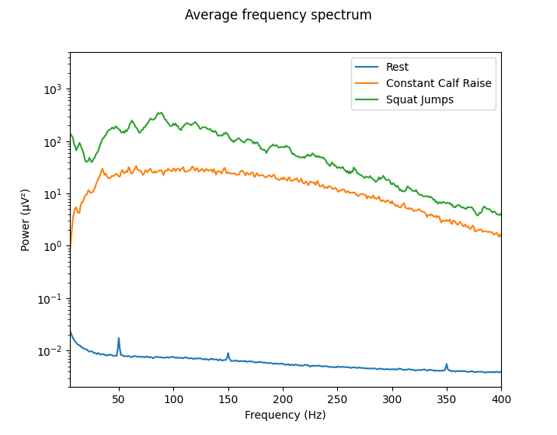 Figure 2: Average frequency spectrum of the sample data during rest, constant calf raise, and squat jumps.
Figure 3 shows four seconds of squat jump data from a single row of channels. Pre-processing only included the removal of the offset with no further filtering. In the plot, you can see that the signal remains stable when jumping and when landing.
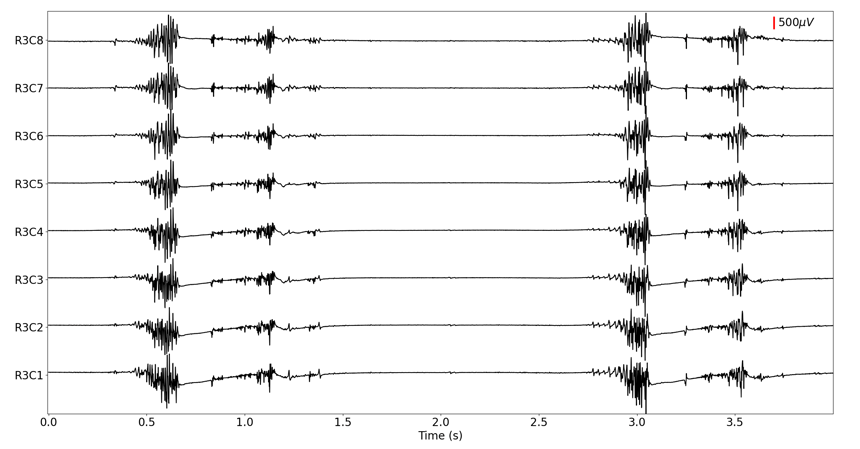 Figure 3: Single row of raw HD-EMG data showing two squat jumps.
How can I view or analyze the data myself?
To view the data, you can import the recordings into our file viewer. To perform data analysis, you can use TMSi Python interface to import the recordings into Python. Please follow the installation instructions in the Documentation TMSi Python Interface. After installation, you can load the data into Python with the example script example_file_reader.py in the folder examples_reading_data of the TMSi Python Interface.
Would you like to see more?
In this video, you can see more of the Textile HD-EMG grids in action. In the video, the live signal during three different movements is shown. Moreover, in this video, we show you how to use the Textile grids.

The Textile HD-EMG grids come in 6 configurations, suited for measuring different muscles. Would you like to learn more about these Textile grids? Click here to book a free demo and ask your questions to our specialists. If you have any questions about this dataset, please email info@tmsi.com.